The world of stocks and investments can be a daunting place, filled with complex terminologies and fluctuating numbers that can seem like a foreign language to many. However, understanding stock market indicators is crucial for investors looking to make informed decisions and navigate the ever-changing landscape of the stock market. In this article, we will decode stock market indicators, shedding light on what investors need to know to make sound investment choices.
Stock Market Indicators
Stock market indicators are key tools used by investors and analysts to evaluate the performance of various stocks and the market as a whole. These indicators provide valuable insights into how a stock or the market is performing, and they help investors make educated decisions. The better an investor understands these indicators, the more they can improve their ability to make informed decisions, reduce risks, and potentially increase their returns.
Price-Earnings (P/E) Ratio
One essential indicator is the Price-Earnings (P/E) ratio, which compares a company's stock price to its earnings per share. The P/E ratio helps investors determine whether a stock is overvalued or undervalued. A high P/E ratio may indicate an overvalued stock, meaning the stock price is higher relative to the company’s earnings. On the other hand, a low P/E ratio could suggest an undervalued stock, indicating that the stock price is lower than what the company’s earnings would justify. It's crucial for investors to consider the P/E ratio when assessing the potential value of a stock, but they should also recognize that the P/E ratio is not a standalone metric. Different industries tend to have different average P/E ratios, and comparing stocks across industries may not always be relevant.
The P/E ratio is often used in conjunction with other metrics to assess the overall health and potential of a company. Investors should be cautious when relying solely on the P/E ratio, as external factors like market sentiment or broader economic conditions can influence stock prices and distort the ratio. Still, the P/E ratio provides a fundamental look at whether a stock is priced appropriately based on its earnings.
Moving Average Convergence Divergence (MACD)
Another vital stock market indicator is the Moving Average Convergence Divergence (MACD), a trend-following momentum indicator that shows the relationship between two moving averages of a stock's price. MACD is widely used to identify potential buy or sell opportunities based on changes in a stock's momentum. The MACD consists of two moving averages: a faster one and a slower one. When the fast-moving average crosses above the slow-moving average, it can signal a buying opportunity, while a cross below may indicate a time to sell.
Understanding how to interpret the MACD can help investors make informed decisions about when to enter or exit a position. However, it is important to note that the MACD is a lagging indicator, meaning it is based on historical price data. This makes it more useful for confirming trends rather than predicting them. Investors who rely on MACD should do so in combination with other indicators to ensure a more comprehensive understanding of a stock’s performance.
Technical Analysis
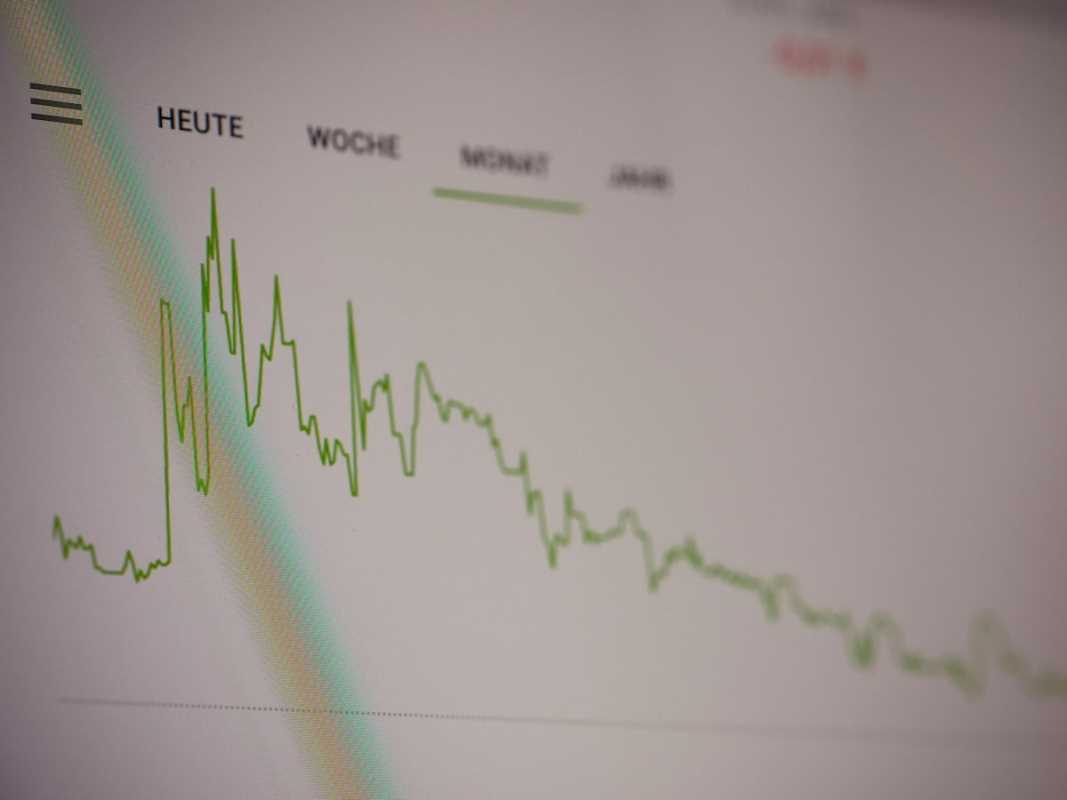
Technical analysis is another important aspect of decoding stock market indicators. This method involves analyzing historical price and volume data to predict future price movements. Technical analysis assumes that past price movements can provide insights into future trends. Investors who use technical analysis often rely on chart patterns, such as head and shoulders or double tops, to identify potential trends and reversals in a stock's price. Chart patterns are visual representations of a stock’s price history and can signal when a trend may be nearing its end or when a new trend is beginning.
By learning how to interpret these patterns, investors can gain insights into possible future price movements and make more strategic investment decisions. However, technical analysis is not an exact science. While it can provide useful information, it should be used in conjunction with other forms of analysis, such as fundamental analysis, to create a well-rounded investment strategy.
Economic Indicators
Investors should also pay attention to economic indicators, such as the Gross Domestic Product (GDP) growth rate, inflation rate, and unemployment rate. These indicators provide valuable insights into the overall health of the economy and can impact stock prices. For example, a strong GDP growth rate may lead to an increase in consumer spending, which can boost corporate earnings and stock prices. Conversely, high inflation or rising unemployment can signal economic challenges that may negatively affect stock performance.
Economic indicators offer a broader perspective on market conditions and should be part of an investor's toolkit when assessing potential risks and opportunities in the market. By staying informed about key economic indicators, investors can better anticipate market trends and adjust their investment strategies accordingly.
Decoding stock market indicators is essential for investors looking to navigate the complexities of the stock market and make informed investment decisions. By understanding key indicators such as the P/E ratio, MACD, technical analysis, and economic indicators, investors can gain valuable insights into stock performance and market trends. Armed with this knowledge, investors can approach the stock market with confidence and make strategic decisions to grow their portfolios.
Though the world of stocks and investments may seem intimidating at first, learning how to interpret these indicators helps demystify the market and enables investors to make better choices. Whether analyzing a stock's value using the P/E ratio, spotting momentum shifts with the MACD, or evaluating broader economic conditions, these indicators are invaluable tools that guide investors on their journey to financial success.


